Execution History
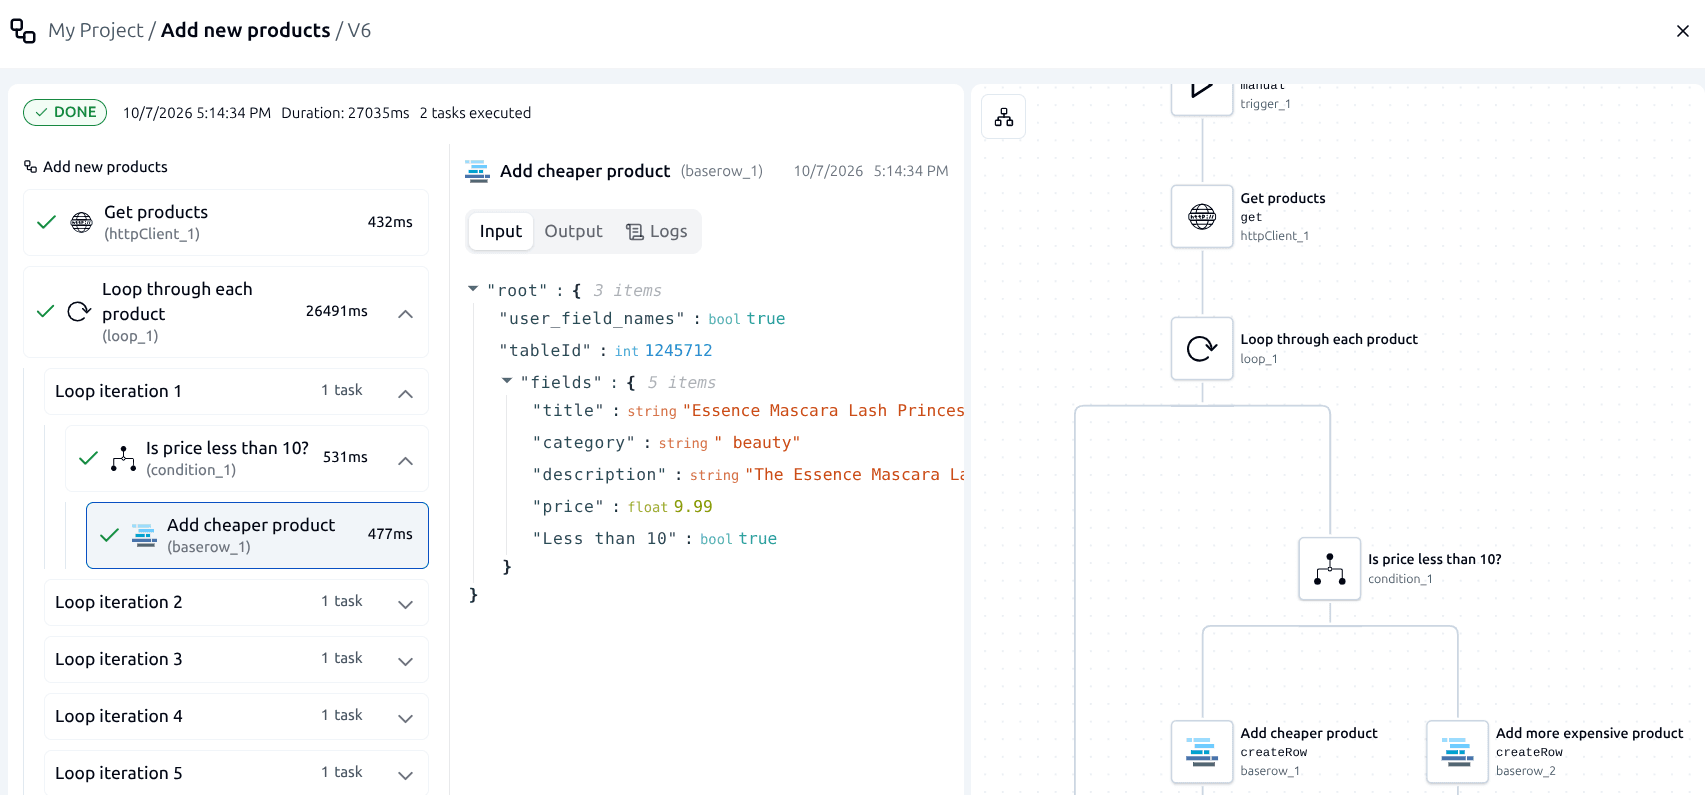
Every workflow execution gives you a detailed record of what happened, which steps ran, what data was processed and where a failure occurred.
Follow each run from trigger to outcome and inspect individual steps when you need to understand what happened.
Nothing about a run stays a mystery
Re-run a failed execution with its exact inputs to reproduce the issue, or re-run with edits to test a fix before it ships. Pin an execution as a test case, or compare two runs side by side to see exactly what diverged.
Full execution timeline
Follow every step of a workflow from trigger to final outcome.
Inputs & outputs
Inspect the data entering and leaving each component.
Execution details
See execution details that help you understand how a workflow performed.
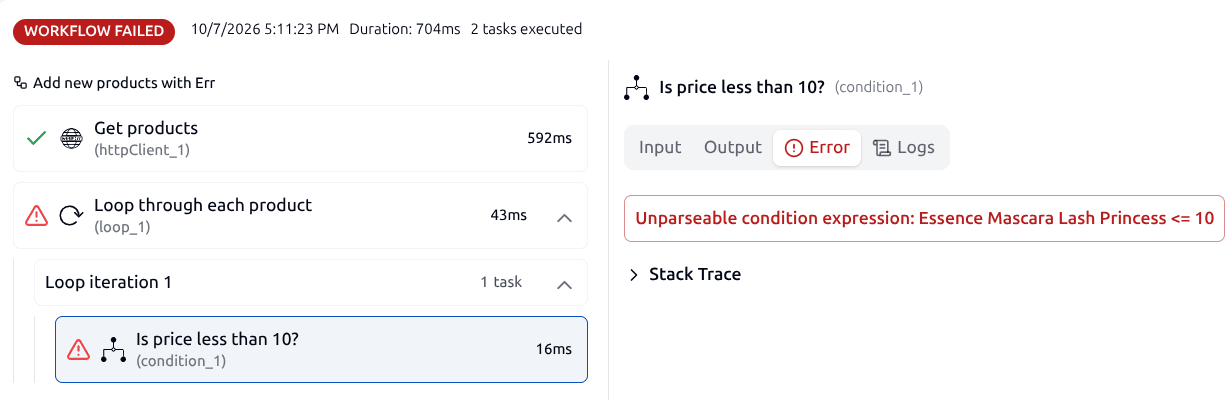
Error diagnostics
See which component failed and the error details needed to investigate it.
Investigate failures without guessing
Open any run and inspect exactly what happened at each step. See the data that entered the component, the result it produced and the error details when something goes wrong.
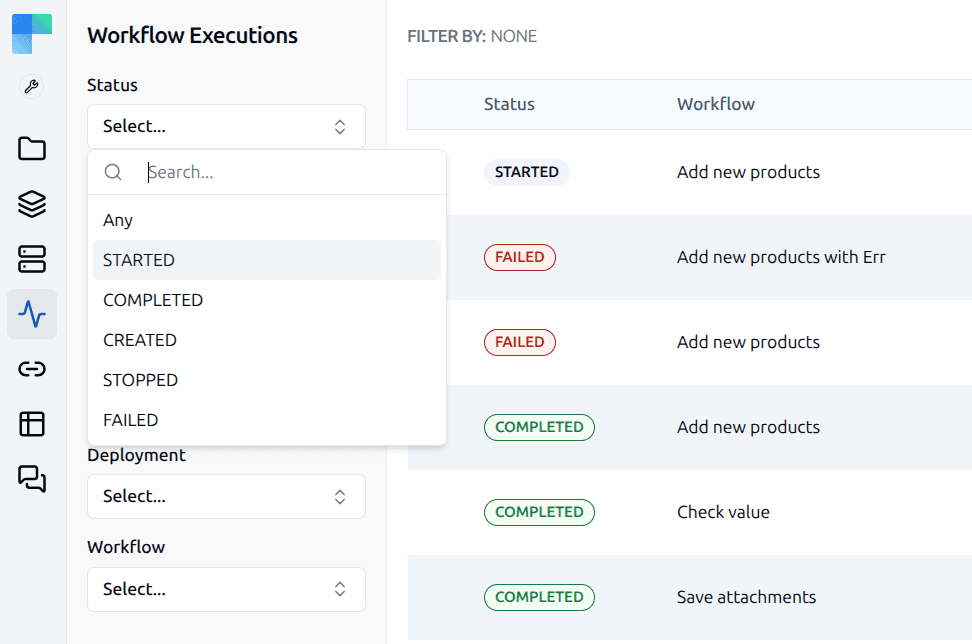
Monitor workflow health in real time
Watch executions as they happen, filter runs by environment, status, date, project, deployment or workflow, and open any execution to inspect its details.
Observability: send it all to the stack you already run
ENTERPRISE EDITIONExecution history answers what one run did. When you need the same detail in the tooling your team already watches, a self-hosted ByteChef exports OpenTelemetry traces, logs and metrics over OTLP. There is no ByteChef-specific agent or protocol - if your stack speaks OpenTelemetry, you point ByteChef at it.
A webhook trigger that fans out into parallel tasks arrives as one trace with the whole task tree, and an execution that hops from coordinator to broker to worker stays a single trace across those services.
Traces
API calls, workflow executions, task dispatches and component invocations each produce spans, correlated under one trace id per run.
Logs
Elastic Common Schema JSON, every line carrying the active trace id, span id and tenant id, so a log line pivots to the trace that produced it.
Metrics
Meters for HTTP requests, the JVM, the process and the system, on the same pipeline.
Or have a run come and find you
Traces and metrics are for the dashboard you check. Notifications are for the thing you need told about: a rule says “when a run reaches this status, tell this target”, and every rule subscribed to that event fires when it happens.
Send the run and its status to an address, or to a list of them.
Webhook
ENTERPRISE EDITIONPost to an endpoint of your own, so a failure opens an incident in the system that owns your on-call rota.
Slack
ENTERPRISE EDITIONPut the run in the channel the team already watches, rather than one more inbox.
Each signal is off until you enable it, and each has its own endpoint, so you can send traces to one backend and metrics to another. See the observability docs.
Don't miss what comes next
Curious what's coming or waiting for a feature to ship? Subscribe to be the first to know when it launches, plus get release notes, new feature announcements and subscriber-only discounts.
By subscribing, you agree to receive emails from ByteChef and to our Privacy Policy. You can unsubscribe at any time.